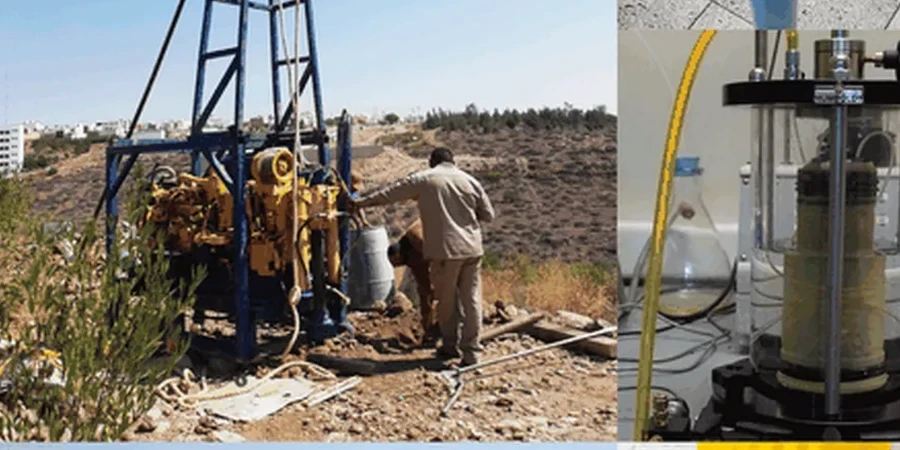
The ground beneath a site in Ashbrooke and the fill over the old shipyards in Hendon tell two entirely different stories, and a single borehole rarely captures the full picture. Our seismic tomography surveys in Sunderland provide a continuous profile of subsurface stiffness, mapping the transition from the Magnesian Limestone ridges down into the deep glacial deposits along the Wear. Whether a project sits on the competent rock of Tunstall Hills or the alluvial silts near the river, we configure both refraction and reflection spreads to resolve stratigraphy and identify potential voids or fractured zones. For detailed material properties once the layering is mapped, our technicians can follow up with a grain-size analysis on samples from targeted test pits, but the geophysical model always defines the investigation strategy first.
Seismic velocity contrasts map the true boundary between Sunderland’s limestone bedrock and the overlying clay cover, removing guesswork from foundation depth decisions.
Regional considerations
The North Sea influence brings a persistent moisture regime to Wearside that saturates the clay cover and masks the true acoustic contrast at rockhead, making dry-season data significantly sharper than surveys run after a wet winter. Sunderland’s position on the eastern edge of the Pennine rain shadow delivers less precipitation than the west, yet the combination of marine clay, industrial fill, and abandoned limestone quarries creates unpredictable velocity inversions that simpler seismic methods miss. We address this by deploying both refraction and high-resolution reflection geometries on every line, because a hidden low-velocity layer—common in buried valleys across the area—will fool a refraction-only interpretation. The resulting tomogram becomes the reference document for planning retention systems, and contractors in Sunderland increasingly request it before committing to excavation depths near the river corridor.
Quick answers
How much does a seismic tomography survey cost in Sunderland?
For a standard 115 m refraction line with 24 geophones, processed and reported, costs in Sunderland typically range from £1,890 to £3,870 depending on the number of spreads, the need for reflection acquisition, and access constraints on site. A multi-line survey with both refraction and reflection coverage will sit at the upper end of that bracket.
Can seismic tomography detect old mine workings beneath my site?
Yes, and it is one of the strongest applications of the method in the Sunderland area. Abandoned mine workings within the Magnesian Limestone or the deeper Coal Measures create a distinct low-velocity signature because the void or collapsed material transmits shear waves more slowly than intact rock. We calibrate the anomaly threshold against known borehole data, and the tomogram shows the lateral extent of the disturbed zone so you can plan targeted drilling or grouting.
How long does field acquisition take on a typical Sunderland site?
A single refraction spread of 115 m with 24 geophones takes roughly 90 minutes of active shooting once the array is laid, and we can acquire three to four spreads in a standard working day. Reflection profiling requires shorter geophone intervals and more shot points, so expect one to two spreads per day, with processing and interpretation requiring an additional three to five working days in the office.
What surface conditions prevent seismic tomography from working?
Hard-standing surfaces such as reinforced concrete slabs or thick asphalt couple poorly with the geophone spikes and dampen high-frequency energy, reducing resolution. In Sunderland’s urban core we often need to drill small pilot holes for geophone placement. Very dry, loose granular fill also attenuates signal, though our post-stack processing can recover usable data if the water table lies within a few metres of the surface.